Study of the glycemic response of chrystalline grape sugars in comparison with other commercial sugars
[1]
The GLYCEMIC INDEX (GI) is defined as “the ratio between the incremental area under the glycemic curve induced by a test food and the similar area obtained following the consumption, in isoglucidic quantity (50 g of available carbohydrates), of a standard food” (FAO/WHO, 1998). It is the parameter that indicates the speed with which a substance enters the circulation causing an increase in the level of glucose in the blood (blood sugar). This rate is expressed as a percentage by taking an equal quantity of glucose as a reference (glucose is assigned a GI = 100).
Sugars are distinguished by their low, medium or high glycemic index. In particular, the GI value is considered: low if less than 55, medium if between 56 and 69, high if greater than 70.
In 2014, a research protocol was set up, aimed to compare the post-prandial glycemic responses and the glycemic index values of crystalline grape sugars from Naturalia Ingredients (CDG = crystalline grape dextrose crystalDEXTROGRAPE, CFG = crystalline grape fructose crystalFRUCTOGRAPE and CSG = crystalline grape sugar crystalGRAPESUGAR[2]) with those detected following the consumption of commercial products, such as sucrose from beetroot or dextrose or fructose from corn or a mixture of them (dextrose: 51%; fructose: 49%). The evaluation of the glycemic index of the products was carried out according to the ISO-26642 procedure[3].
The protocol used for the determination of the Glycemic Index was submitted to and obtained a favorable opinion from the Ethics Committee of the University of Milan. Each study participant signed an informed consent form.
To estimate the portions of sugars to be administered during the tests (corresponding to 25 g of available carbohydrates), the humidity assessed on the samples themselves was taken into account.
For the evaluation of the post-prandial glycemic response of the aforementioned products, 12 healthy adult subjects, aged between 20 and 26 years, male and female, volunteers, were recruited, selected on the basis of the indications in the literature (not affected by food allergies, not on pharmacological therapy, not in confirmed or presumed pregnancy) (Wolever TMS, et al.2008[4]). The parameters evaluated on the subjects were: sex, age, height, weight, body mass index, basal blood glucose levels.
Each subject consumed, with a frequency of once a week, 6 test meals based on sugars and 3 standard meals based on 25g of glucose. Each sugar was administered after being dissolved, on the morning of the test, in 500 ml of tea. The subjects had to show up on the day of the test, fasting for at least 10 hours, without having consumed alcohol or carried out intense physical activity during the previous evening.
Table 1 shows the anthropometric data, age and basal blood sugar values of the volunteers involved in the study.
Table 1: Anthropometric characteristics and basal blood glucose values of the volunteers.

The group of volunteers involved had normal mean BMI and basal blood sugar values; the latter were not significantly different from each other in the different meals.
Capillary blood samples were taken on the subjects, fasting since the previous evening (at least 10 hours), before and after consumption of the load of the glucose control or of the other sugars to be tested (times: 0, 15, 30, 45, 60, 90, 120); the determination of the glucose concentration in the blood samples was carried out using an enzymatic method (STAT 2300 YSI clinical analyzer).
For each subject and for each test the incremental areas (IAUC) underlying the postprandial glycemic curves were calculated.
Then the Glycemic Index (GI) of the products was calculated using the relationship:

Where:
Tested sugar IAUC = incremental glycemic area of tested sugars
IAUC glucose load = average of the incremental glycemic areas of the three tests carried out with glucose load (reference standard food).
Data were expressed as mean ± SE; all results were subjected to repeated measures analysis of variance (RM-ANOVA), in order to identify differences in effect due to the different sugars. The Tukey test (TukeyHSD), applied post hoc, was then used to compare the effect of each meal with that of all the others. All statistical calculations were carried out using Statistica software from Statsoft Inc. Furthermore, in accordance with the ISO 26642 methodology, the GI values obtained were subjected to verification of the “outliers”, i.e. the identification of those results (of the 12 values of GI obtained for each product) that fell outside the Average + 2 Std Dev range, for their possible elimination.
Figure 1 shows the average incremental glycemic profiles, obtained by deducting the basal glycemic value at the levels detected at each sampling time; the table below the figure also shows the results of the statistical analysis carried out to verify the differences between the glycemic levels induced by the different sugars at the sampling times. The RM-ANOVA statistical analysis conducted on the curves reveals that the type of meal influences post-prandial glycaemia in a highly significant manner (p < 0.001).
Figure 1: Incremental glycemic curves evaluated after consumption of the different sugars tested (Average ± SE) and significant differences (p < 0.05) for the Tukey-HSD test between blood glucose levels at different sampling times. Legend: GluSTD = corn glucose (control); Fru = corn fructose; Glu+Fru = blend of corn glucose and fructose (51:49); Sac = sucrose; CSG (crystalline grape sugar); CDG (crystalline grape dextrose); CFG (crystalline grape fructose).
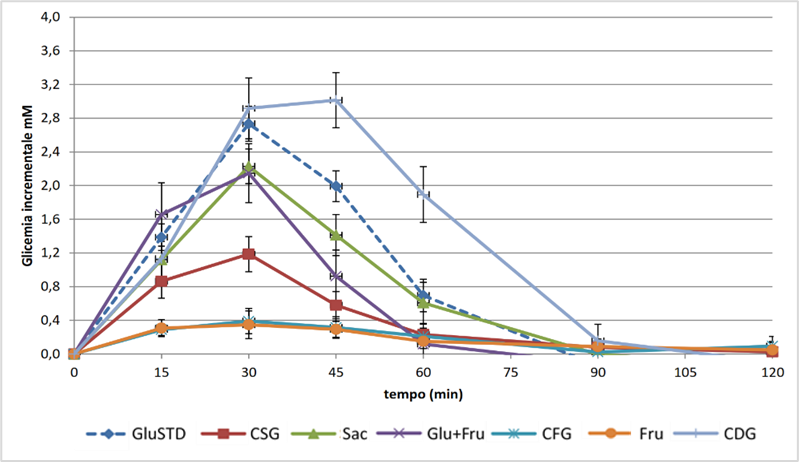

The trend of the post-prandial glycemic curve relating to the consumption of sugars shows, as expected, a peak at 30 minutes and a restoration of basal values within approximately 90 minutes from the start of the test. After 1.5 hours of consumption, for all the sugars tested, with the exception of fructose from both grapes and corn, glycemic levels lower than those of basal glycemia were detected. The glycemic profiles induced by the consumption of the two types of fructose tested showed, as expected, decidedly lower values than those detected for all the other sugars, with a much more gradual restoration of baseline values. The lower glycemic impact of fructose is probably due to its metabolic fate, which involves the conversion into glucose of approximately 50% of the quantity of this sugar that reaches the liver after absorption, and its subsequent passage into circulation (Tappy L. et al. 2010)[5]. Sucrose and the mixtures of glucose and fructose showed intermediate glycemic profiles, and in particular, 30 minutes after consumption, significantly lower glycemic levels were detected for the mixture from grapes than those detected for the mixture of sugars from corn and for sucrose.
For each subject and for each test, the incremental areas (IAUC) underlying the postprandial glycemic curves were calculated from which GI values of the six products tested were derived (Figure 2; table 2).
Figure 2: GI values of the 6 tested products.
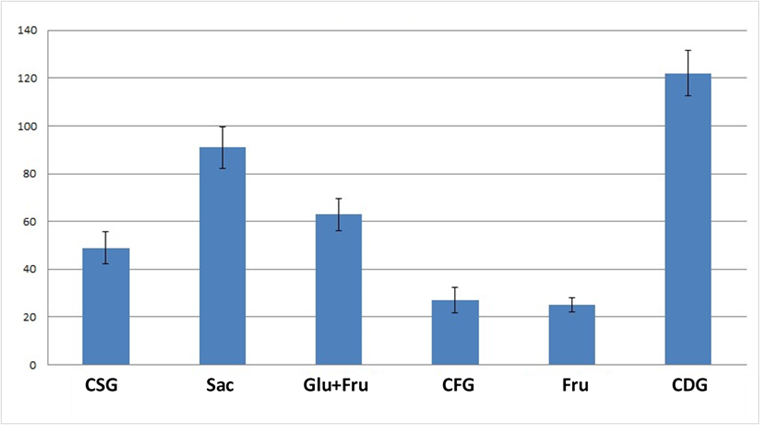
Table 2: GI values calculated for the sugars tested (Average ± SE); values in the same row reporting different letters are significantly different at p < 0.05.

For the statistical analysis of the GI results, statistical comparisons with the GI values of glucose were not carried out since the latter are arbitrarily considered equal to 100 and not determined analytically.
As expected, the highest GI value was found for the CDG product, consisting of readily assimilable crystalline glucose, while the lowest GI values were found for fructose, for which no significant differences were highlighted depending on the botanical origin. These results are in agreement with data in the literature reporting exceptionally low GI values for fructose (http://www.glycemicindex.com/).
In particular, the results obtained for the mixtures of glucose and fructose appear interesting in comparison with those found for sucrose, a disaccharide made up of the two aforementioned monosaccharides. The two mixtures, in fact, have low average GI values (CSG=49 and glucose+fructose from corn=63) and are not different from each other but significantly (p<0.05) lower than the GI value found for sucrose (91). These results seem to suggest that the consumption of mixtures of the two monosaccharides containing free glucose, and therefore immediately available for absorption, can stimulate the immediate secretion of insulin which, in turn, promotes the uptake of glucose from the tissues and therefore a faster reduction in circulating glucose levels. In the case of sucrose, however, the passage of glucose into the circulation may be “more delayed”, an effect probably attributable to the fact that this disaccharide must undergo hydrolysis by the enzymes of the absorptive mucosa before the glucose that composes it can pass into the circulation.
[1] Images and contents of this document are taken from the study described in detail in the Degree Thesis in Food Science and Technology by Dr. Laura Costantino “EVALUATION OF THE GLYCEMIC RESPONSE OF COMMERCIAL SUGAR DERIVED FROM DIFFERENT PLANT SOURCES”.
[2] At the time of the study the commercial name of grape sugar was crystalSWEETGRAPE.
[3] INTERNATIONAL STANDARD ISO 26642:2010(E): Food products — Determination of the glycaemic index (GI) and recommendation for food classification.
[4] Wolever TMS, et al. Measuring the glycemic index of foods: interlaboratory study. Am J Clin Nutr.(2008) 87(1):247S-257S.
[5] Tappy L, Le KA. Metabolic effects of fructose and the worldwide increase in obesity. Physiol Rev 90:23-46, 2010.